San Francisco County's 2025 assessment roll does not show one uniform condo story. The dominant pattern is familiar: most matched parcels moved almost exactly 2%. But thousands moved in the opposite direction, and those decreases were unevenly distributed across the county.
That matters because assessed value is not the same as a sale price or a market estimate. The roll is a tax-administration record built under California assessment rules. It can still reveal where assessments moved differently, as long as the analysis does not treat those movements as a direct market-price index.
 South of Market skyline in 2021. Photo by Alfred Twu, CC0 1.0 Universal Public Domain Dedication via Wikimedia Commons.

What the 2025 condo roll shows
The county's public historical secured roll contains one row per parcel for each closed roll year. The official property assessment data page identifies the 2025-2026 roll as based on assessed values as of the January 1, 2025 lien date.
For 2025, the roll contains 211,547 secured parcels countywide. Our residential-condo filter contains 58,698 parcels, or 27.7% of that roll. The comparable 2024 filter contains 58,604 parcels. These are not perfectly identical cohorts: 58,532 parcel numbers appear in both years, while 166 enter the filtered 2025 cohort and 72 appear only in 2024.
For the matched analysis, we added assessed land and assessed improvement value for each parcel. We excluded 35 matched parcels with a zero 2024 combined value because a percentage change from zero is undefined. That leaves a denominator of 58,497.
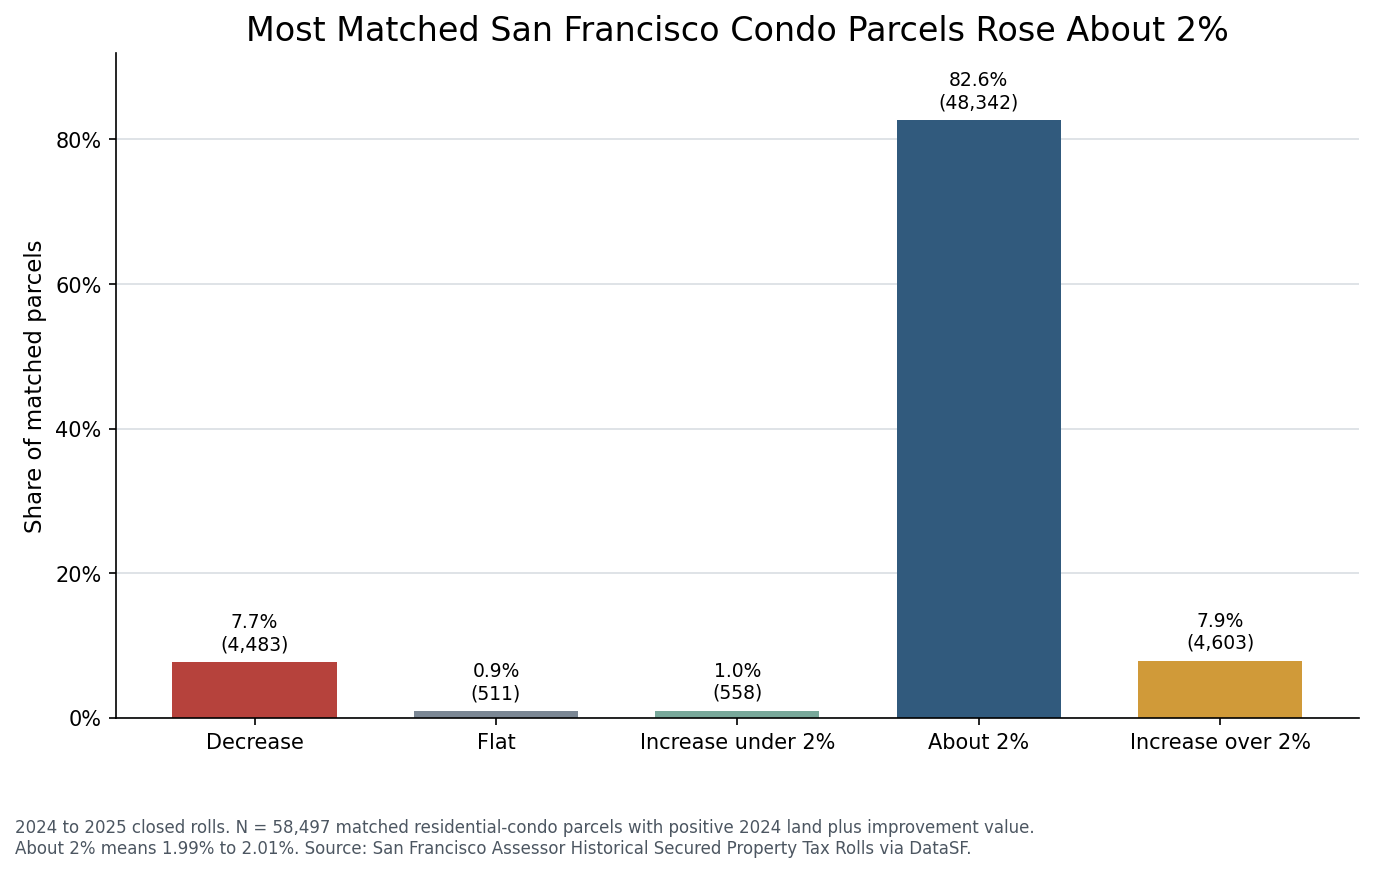 Change in assessed land plus improvement value for matched residential-condo parcels from the 2024 to 2025 closed rolls. Source: San Francisco Assessor data via DataSF. N = 58,497.
The largest category is the 48,342 parcels, 82.6% of the matched denominator, whose combined assessed value rose between 1.99% and 2.01%. Another 4,603 parcels, 7.9%, rose more than 2.01%. On the other side, 4,483 parcels, 7.7%, declined by more than 0.01%. The remaining 1.8% were flat or increased by less than 1.99%.
The matched cohort's combined assessed land and improvement value rose 1.96%, from $60.27 billion to $61.45 billion. The full filtered cohorts rose 2.39%, from $60.28 billion in 2024 to $61.72 billion in 2025, but that comparison includes the entering and exiting parcels. It should not be read as appreciation for a fixed set of properties.
The decreases were not evenly distributed
Neighborhood matching produces the more useful finding. Among the ten largest analysis-neighborhood condo cohorts, the share with a lower combined assessment ranged from 4.2% in Pacific Heights to 13.7% in South of Market.
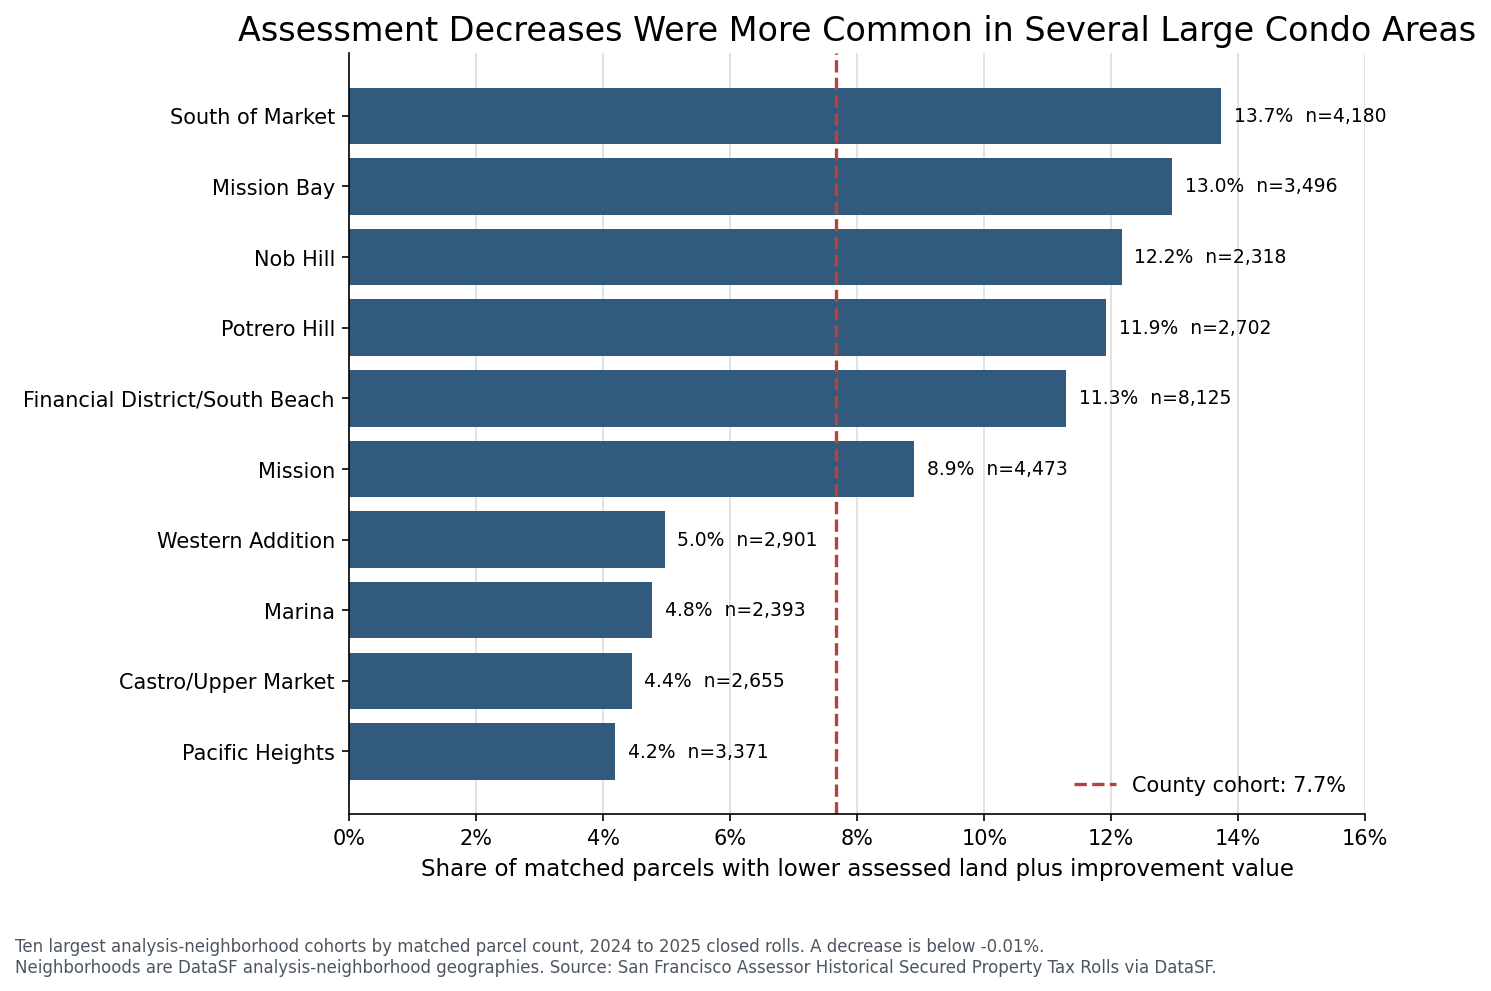 Share of matched parcels with lower assessed land plus improvement value in the ten largest condo neighborhood cohorts. Source: San Francisco Assessor data via DataSF, 2024 and 2025 closed rolls.
South of Market had 574 decreases among 4,180 matched parcels, or 13.7%. Mission Bay had 453 among 3,496, or 13.0%. Nob Hill reached 12.2%, Potrero Hill 11.9%, and Financial District/South Beach 11.3%. By comparison, the matched county condo cohort was 7.7%.
This pattern is consistent with official evidence that condominium decline-in-value activity remained important, but the roll cannot identify the cause of each change. A 2025 city financing disclosure reports that the Assessor completed 10,739 decline-in-value reviews for the January 1, 2025 lien date and enrolled 9,375 Proposition 8 reductions totaling $4.84 billion across property types. It says condominiums represented 51% of temporary reduction value after hotels were excluded. The same disclosure describes a separate project involving open condo and dwelling appeals. Those countywide figures support the broad pattern, but they do not prove that every decrease in our matched sample was a Proposition 8 reduction.
Why 2% is not a market-price signal
The clustering near 2% is consistent with California's factored base-year system. The State Board of Equalization's Proposition 8 guidance explains that base-year value is generally adjusted by the lower of California inflation or 2%, while the assessor enrolls the lower of factored base-year value or current market value as of January 1.
That does not let us assign a reason to an individual parcel from this dataset. A change above 2% can occur when a temporary Proposition 8 value is restored, and it can also reflect a change in ownership, new construction, or corrections. A decrease may reflect a decline-in-value assessment, but could also involve corrections or classification changes. The roll does not expose the parcel's factored base-year value, Proposition 8 status, appeal outcome, or reason code.
The sales market also provides counterevidence against interpreting assessment decreases as a simple countywide condo downturn. Vanguard's 2025 San Francisco market review, using SFAR MLS and BrokerMetrics, reports a 2.2% increase in median sale price to $1.15 million and an 11.4% increase in sales to 2,594. Its housing mix includes condominiums, loft condominiums, tenancy-in-common interests, and stock cooperatives, and covers only properties posted to the MLS. That is not the same geography-and-property cohort as the assessor roll, but the difference is instructive: assessment movement and transaction-market movement measure different things.
For more background, see our guides to market value versus assessed value and Proposition 8 versus Proposition 13.
Methodology and limits
We used the official Assessor-Recorder property class reference and included only the residential codes Z, ZBM, ZEU, LZ, and LZBM. These mean Condominium, Condominium BMR, Condominium Economic Unit, Live/Work Condominium, and Live/Work Condominium BMR. We excluded commercial store, office, industrial, parking, garage, and bank condominium codes.
The 2024 rows are dated June 9, 2025, and the 2025 rows June 26, 2026. Land, improvement, area, lot, and unit fields are populated numerically, but zero is frequently used and should not automatically be interpreted as a true physical zero. Parcel matching controls for most cohort change, not for every correction or reclassification. Analysis-neighborhood labels are geographic groupings, not buildings or sales submarkets.
The practical takeaway is modest. A countywide average hides a meaningful distribution, and a neighborhood pattern is a screening signal rather than proof about any one unit. Owners reviewing a future assessment should compare their own notice with property-specific evidence as of the applicable January 1 lien date and use the Assessor's current instructions, not an aggregate chart, to decide whether further review is warranted.